Enhanced Oil Recovery research, Advanced Instrumentation Research Group
Enhanced Oil Recovery
The principle of injecting gases such as N2 and CO2 into oilfields to manage reservoir resources is well understood. The Yates Field – a mature site in West Texas – presented Kinder Morgan with particular difficulties, with the requirement to inject low pressure CO2 with flow control and measurement at the well-head. The low pressure and high ambient temperatures lead to almost continuous flashing, with gas void fractions (GVFs) estimated to range between 0% and 80%. A solar and wind powered station was designed around a two-phase capable Coriolis mass flow meter. As well as metering the flow, the station controls it using a modulating valve, based on the two-phase flow measurement. A wireless communication system maintains contact with the central control. Some 20 stations have been operating successfully for since 2004, enabling effective reservoir management techniques.
1. The Yates Field
The Yates Field, near the town of Iraan, West Texas, has been one of the most productive oil fields in history. Discovered on a remote farm in the Texan desert in 1927, its production peaked at 41 million barrels (6.5 million cubic meters) in 1929, but by 1941 the yield had dropped to under 6 million barrels (0.95 Mm3). A range of techniques for managing and maintaining reservoir production have been developed throughout the 20th century, and in the late 60s salt water and natural gas were injected into the field to maintain pressure, with the effect of doubling oil production. In 1985 the billionth barrel of oil was produced; the yield in 1989 was 27 million barrels (4.29 Mm3), but despite increasingly sophisticated reservoir management techniques this had dropped to 10.2 million barrels (1.62 Mm3) in 2007.
Between 1985 and 1991 carbon dioxide injection was introduced as a new technique for maintaining reservoir pressure. High pressure (liquid) CO2 was supplied to Pecos Station, the central supply point for the oilfield (Figure 1), where it was metered by the supplier for sales purposes. The CO2 was then piped to ten well-heads for injection without further metering. Typically 35 million standard cubic feet (5.56 Mm3) of CO2 were supplied per day to the Yates Field.
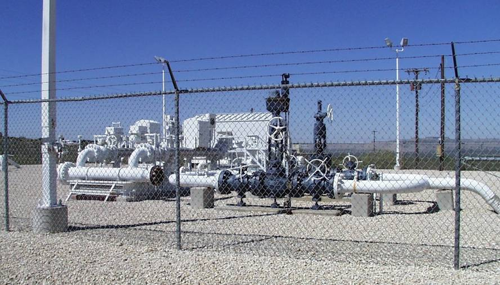
Figure 1 Pecos Station, central supply point for CO2 injection
Between 1991 and 2004, the scheme was replaced by nitrogen injection, with volumes raised to 14.3 Mm3 per day. At the same time steam heating was used to warm the reservoir and improve production. The high pressure gas injection involved high capital and operating costs. For example 900lb class pipework was required, which was installed underground to avoid temperature extremes, while at the well-head CO2 heating was provided (Figure 2) to ensure that the reservoir was not unduly cooled by the injection stream.
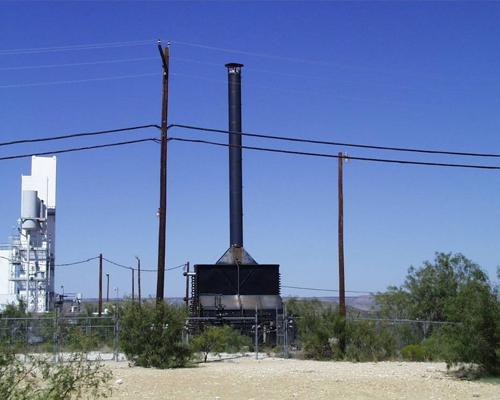
Figure 2 Obsolete CO2 heating station
New Installation Requirements
In 2004, a new project was initiated by Kinder Morgan with the following objectives:
-
Increase CO2 injection to 100 million standard cubic feet (15.9 Mm3)
-
Provide metering and flow control at the well-head, with separate flow set-points for each well
-
Maintain the lowest pressure possible at the well-head (minimising the cooling effect of gas injection on the steam-heated reservoir)
-
Provide standalone well-head field stations with radio communications and wind/solar power supply.
The potential benefits of this project included using lower cost 600lb class pipework, laid over-ground, and the elimination of CO2 heating requirement at each well-head. The key challenge lay in performing closed loop flow control on what was likely to be a two-phase stream of carbon dioxide.
As in previous injection schemes, CO2 is supplied to the Pecos Station, at a super-critical pressure of 1200psi (8.27MPa), so that a conventional flowmeter can be used to monitor the total flow for sales purposes. The supply pressure to the field is tightly maintained between 1000 – 1020 psi (6.89 - 7.03MPa), but as a result of pressure losses through the 12 mile pipeline network the individual well-heads receive the CO2 at 800-1020 psi (5.52-7.03MPa) pressure and between 40-90 ºF (4-32 ºC). The resulting phase envelope (Figure 3) indicates phase transitions between liquid and gas. This is confirmed by observations in the field: gas/liquid slugging is common, with for example the CO2 density cycling between 128-880 kg/m3 slowly over the diurnal cycle (see Figure 6 later in the paper) or as rapidly as every 90 seconds at one field station. Such patterns of two-phase flow behaviour vary with environmental conditions (temperature, sunshine, rain fall), as well as the altitude of the well-head (in what is hilly terrain) relative to the supply pipeline.
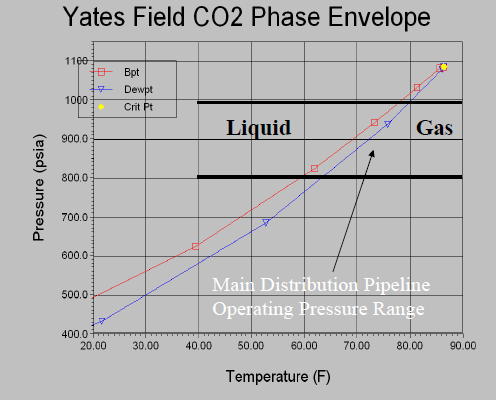
Figure 3. Phase envelope for low pressure CO2 delivery pipeline.
Meter Selection
While metering CO2 above its critical point at Pecos Station is a straightforward flow application, measuring a two-phase mixture at the well-head is a challenge, and to apply feedback control to the resulting flow measurement may be described as ambitious. When the basic pipework infrastructure was laid, simple, low-cost orifice plate and differential pressure (DP) metering was installed at each well-head as a temporary solution. By comparing the totalised flow of the well-head meters against the accurate reference of the sales meter at Pecos Station, it was possible to assess their accuracy. The orifice plate and DP metering was found to be in error by up to 80%, and alternative metering technologies were tested, including vortex and Coriolis meters, by installing them in series at one well-head.
The Invensys Coriolis mass flow meter, based on technology developed by the UTC has a two-phase flow metering capability, and the field trials on a single unit showed promise in several respects. The meter was able to maintain operation through slugging two-phase CO2, gave plausible flow readings, and required only moderate drive current. The power issue is of particular importance for a remote application with only solar and wind power sources and limited battery storage. Given the success of the single unit, a further nine were installed, allowing a quantitative assessment of the measurement performance. Figure 4 shows the results of the comparison between the ten Coriolis meters and the Pecos station sales meter over several weeks. Overall there was a difference of 5%, which was considered acceptable by the customer. Note that the development of a bespoke two-phase model for carbon dioxide could improve on this performance.
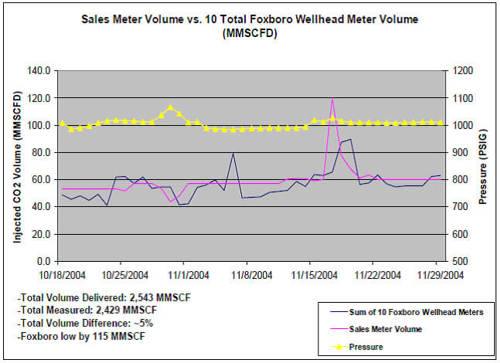
Figure 4. Field trial comparing 10 Coriolis meters in two-phase conditions against sales meter in single phase
Field Station Design
Figure 5 shows one of the twenty well-head field stations deployed in the Yates Field. The equipment consists of (proceeding from the right of the picture) the Coriolis flowtube and transmitter, the modulating flow control valve, a multivariable pressure sensor across the valve (not labelled), the equipment cabinet containing the local display, the PLC, 900MHz radio communication equipment and the rechargeable battery, the solar panel and wind turbine (at the top of the mast), and finally the well-head itself.
The combination of wind turbine (400watts) and solar panel (150 watts) has successfully generated sufficient electrical power to drive each field station through four years of continuous operation. The battery system provides electrical storage for surplus generated energy, most obviously for use at night. Pneumatic power is supplied to the valve from the carbon dioxide line itself, so that no separate air supply is needed. The Coriolis flowtube is mechanically supported by a brace, and a static mixing plate is used to protect the flowtube from excessive vibration generated by slugs of CO2. The PLC communicates via radio to the central control system, receiving the flow set-point and reporting measurement and status information. The PLC runs a PID algorithm regulating the valve position to maintain the supplied flow set-point given the flow measurement generated by the Coriolis flow meter.

Figure 5. Field Station
Oil Reservoir Management
In the office, the network is controlled and monitored. For example, Figure 6 shows the CO2 density trends observed at four well-heads over three days, illustrating the interaction between diurnal changes and short-term fluctuations. Flow set-points can be changed on the fly. Communications quality is monitored and alarmed. All alarms are logged and sent via a pager system to field personnel.
Reservoir management personnel are able to use the system to guarantee delivery of the required quantity of CO2 into the reservoir via 20 injection wells. Typically the targets are set on a daily basis, and though the initial set-points are selected to deliver the required volume, and the system automatically responds to pressure and/or temperature swings, there can be further adjustments towards the end of the day to ensure the daily target is delivered. The fine tuning of the flow between each of the wells (typically there is a 3:1 turndown in target CO2 delivery across the 20 injector wells) is based on bottom-hole pressure and yield rate on adjacent production wells. Overall, the system is highly rated by the reservoir management team after several years of continual operation.
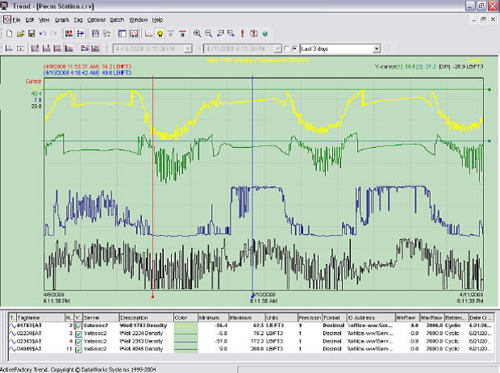
Figure 6. Central monitoring of density variations observed at 4 field stations over 72 hours.