Radio Channel Measurements
Radio Channel Measurements
Using a Vector Network analyser, channel impulse responses were measured in the location shown in the plan below. These had a spatial resolution of around 2ns, at the spot frequency of 5.5GHz. By taking measurements over a synthetic volume aperture, consisting of 20x20x2 locations, near-field matched filtering could be used to image the incoming multipaths at any time instant. These multipaths are represented in two ways:
- By comparing signal strength at a given range and azimuth. The approximate locations of the walls are included on the animated display. This shows the sequence of multipath arrivals from a Tx to an Rx, using a linear luminance scale. A sample channel impulse response is also included below.
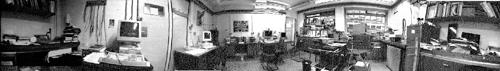
- Alternatively, the incoming signals can be imaged, and represented as an animated set of photographs, which can be compared to the 360 degree photograph of the environment in which the measurements were performed. The first signal on the animation corresponds to the line-of-sight path, and all subsequent signals to reflections both within and outside the room. The frame increment is 1ns, and the animation corresponds to the first 29ns.