21 Apr 2020
COVID-19: UK population movement decreases by 98%
Oxford researchers create Impact Monitor to reveal how life in the UK is changing during the pandemic

An ordinarily busy Broad St is deserted as Oxford residents stay at home.
A new online tool from Oxford researchers uses mobile phone data to help tackle Covid-19. Data from mobile phones is being used to understand and predict the impact of the UK’s Covid-19 social distancing measures on population movements nationwide, thanks to a new online tool developed by a team of AI and big data researchers at the University of Oxford.
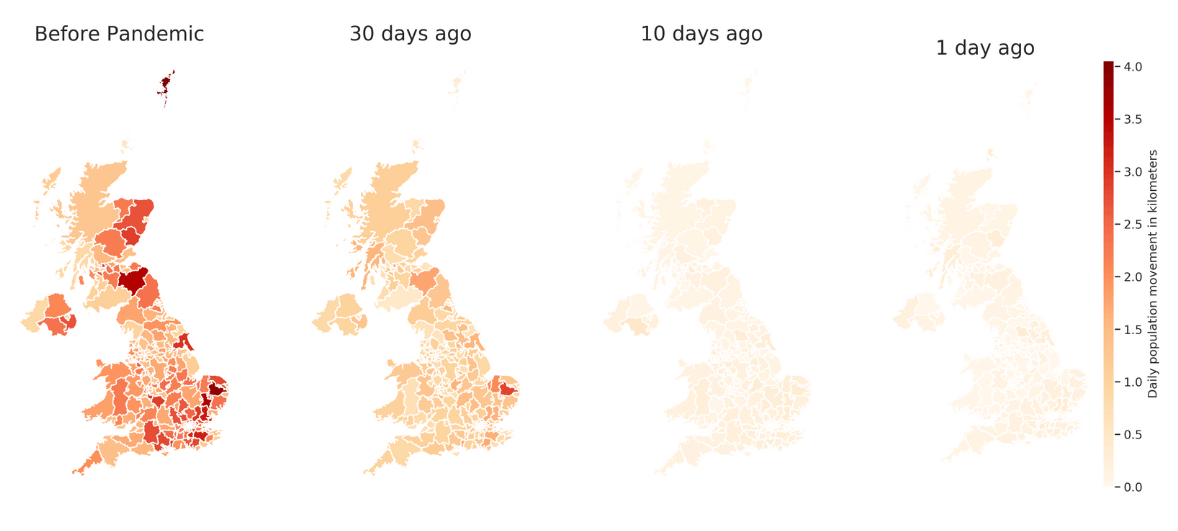
The Oxford Covid-19 Impact Monitor has already revealed how life in the UK has changed since the Coronavirus outbreak:
Population movement has dropped by 98% since the beginning of March
- 55% of Britons stayed at home on Easter Monday
- The least busiest time to visit a supermarket is Tuesday at 9 am
Despite a surge in Covid-19 hospital admissions, overall hospital footfall has fallen by 80%
- 19 million Britons are the most at risk of Covid-19 because of age and underlying health conditions
- The flow of people between regions in the UK has tumbled by 76%


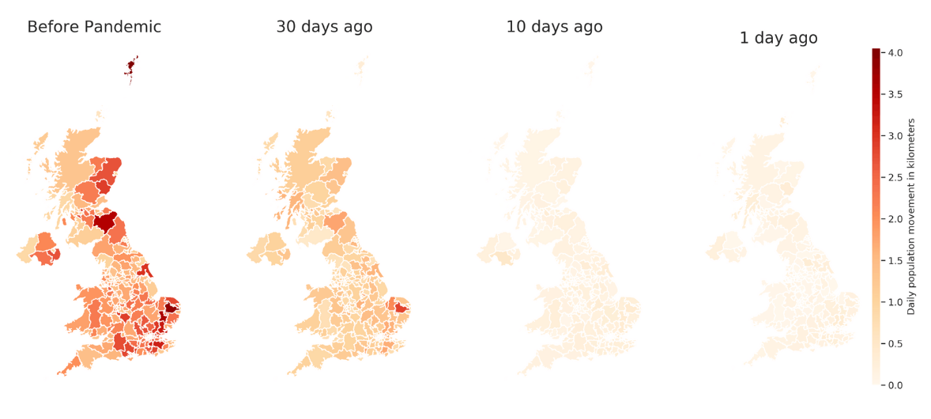
UK population movement data as of 21/04/2020.
Dr Steven Reece, a researcher from the Machine Learning Group at the Department of Engineering Science, is a project contributor using machine learning techniques with the data to try and model the impact that mobility has on the spread of COVID-19 in the UK. Dr Reece explains,
"How Covid-19 spreads through the population and how we exit the lockdown without significant impact from further waves crucially depends on how population mobility is managed. Using machine learning will help track and predict the effects of these control measures."
Dr Xiaowen Dong, Departmental Lecturer from the Department of Engineering Science, also contributes to the project through advising on data processing steps and new possible analysis.
To allay privacy concerns the Oxford Covid-19 Impact Monitor only uses anonymised and aggregated mobile phone location data. This GDPR-compliant data is then used to power interactive digital dashboards that can help policymakers, clinicians and the general public to understand better the impact of Covid-19 on the NHS and the wider community. The online dashboards are free and publicly available, together with key insights from the data. Analyses can be carried out at different degrees of geographic detail, including at the local and regional levels, and also for specific NHS hospital catchment areas.
The new tool was developed by a team from across the University of Oxford led by Dr Adam Saunders (SKOPE, Department of Education) and Dr Matthias Qian (Department of Economics). Team members include Daniel Pesch (Saïd Business School), Dr Steven Reece (Department of Engineering Science), Dr Xiaowen Dong (Department of Engineering Science), Dr Won Do Lee (Transport Studies Unit, School of Geography and the Environment), Professor Renaud Lambiotte (Mathematical Institute) and Lucas Kruitwagen (School of Geography and the Environment).
Project partners include:
Oracle - supporting the online tool with cloud-based high performance computing
Cuebiq - providing anonymised and aggregated data from opted-in users via its Data for Good programme
CKDelta - providing a wide array of anonymised and aggregated data
Facebook’s Data for Good programme – which provided the UK population density map base layer, built with satellite imagery and census data, for validation purposes.
The Oxford COVID-19 Impact Monitor is available at oxford-covid-19.com.


